
SPECTRA Blog / Space Utilisation
How Often Do You Really Use Every Room In Your Home?
Most people dramatically overestimate how much they use certain rooms and underestimate others. Data from AI home intelligence platforms is revealing surprising truths about how we actually live.
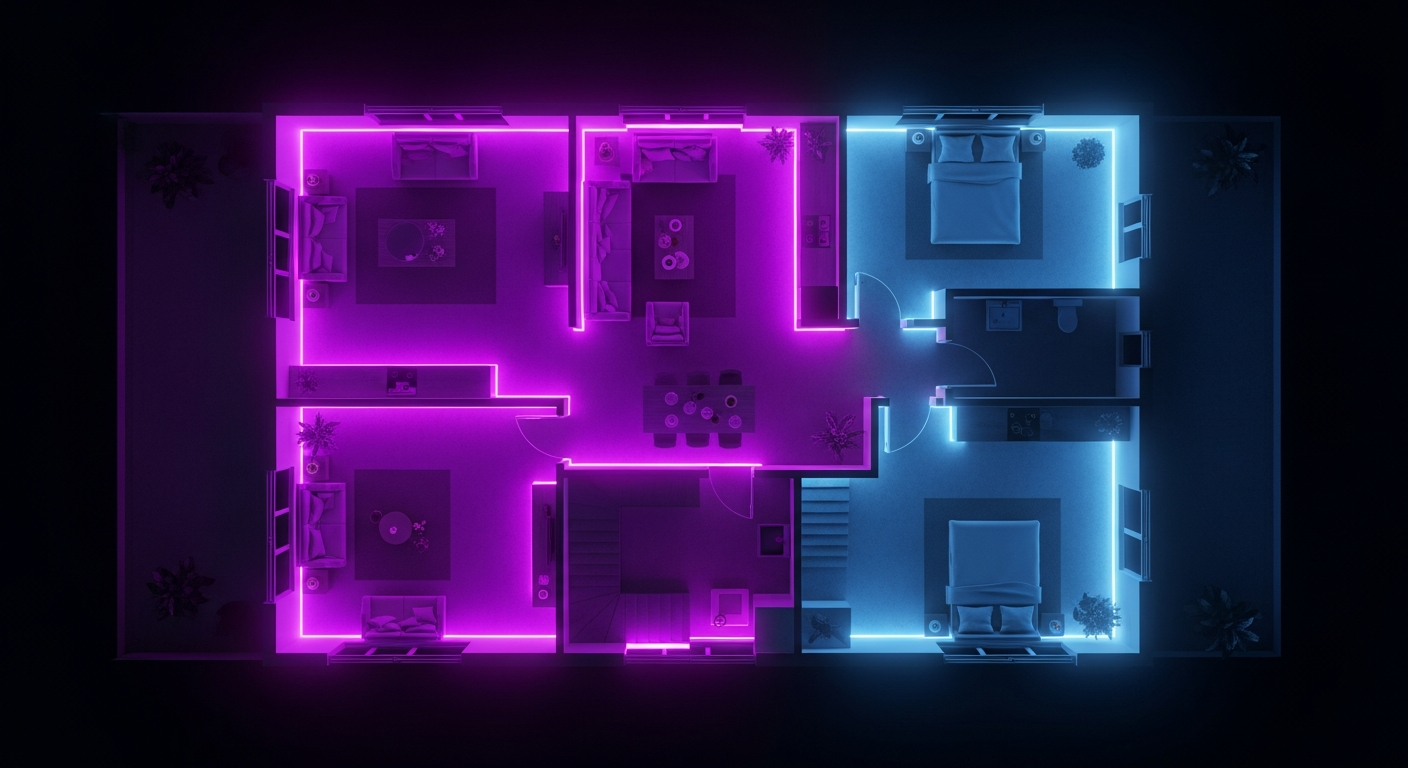
The Assumption Gap
If you were asked to guess which rooms in your home you use most, you would probably say the kitchen and living room. You might mention the bedroom. You would probably not mention the dining room — because, if you are like most households, you rarely use it.
But how certain are you? Could you say with confidence what percentage of the day each room is occupied? Which rooms are active in the morning versus the evening? Whether your home office is actually being used more on Thursdays than Mondays?
Most people cannot. And the gap between what we assume about our homes and how we actually use them is often significant.
What The Data Shows
AI home intelligence platforms collecting occupancy data across real homes consistently reveal a similar pattern:
The 20/80 Principle Of Home Usage
Typically, around 20% of a home's floor space accounts for 80% of the time occupants spend inside it. The kitchen, one or two primary living spaces and the main bedroom dominate daily patterns. Other rooms — a formal dining room, a spare bedroom, a study used mainly for storage — may be occupied for just minutes each day.
Morning And Evening Concentration
Home usage is heavily concentrated in two windows: the morning routine (typically 6-9am) and the evening wind-down (5-10pm). During working hours on weekdays, many homes sit almost entirely empty even when occupants are working from home and using just one room.
The Dining Room Problem
In most Western homes, the formal dining room is one of the least-used spaces relative to its floor area. Data consistently shows that families eat in the kitchen, on the sofa or at a kitchen island — the dedicated dining room is reserved for special occasions.
The Home Office Reality
Since 2020, the home office has become one of the most important spaces in the residential property market. But data reveals a nuance: home offices are typically used intensively for 4-6 hours on working days and barely at all at other times. A room that justifies significant floor space based on 30 hours of weekly use may not warrant its allocation once the data is visible.
Why This Matters
Renovation Decisions
Understanding actual usage patterns before renovating means investing in spaces that will deliver genuine value. Extending a dining room that is only used eight times a year may be less valuable than extending the kitchen that is used three times a day.
Energy Efficiency
Heating and cooling rooms that are unoccupied for most of the day is one of the largest sources of residential energy waste. Space utilisation data enables demand-driven climate control — heating rooms when they are actually about to be used, not simply because it is a certain time of day.
Property Planning
When considering a move, space utilisation data from your current home provides evidence-based insight into how much space you actually need — rather than how much space you think you want.
Estate Agent Positioning
For vendors, demonstrating that a property's main living spaces are high-traffic, desirable areas — supported by real usage data — adds credibility to marketing claims about open-plan living and practical layouts.
How To Measure Your Home's Space Utilisation
Without a dedicated home intelligence platform, tracking room usage requires manual logging — which nobody does. With SPECTRA, space utilisation is measured automatically:
1. LiDAR scan your home to create an accurate 3D model
2. Connect your WiFi router to enable occupancy sensing
3. View your analytics dashboard — SPECTRA shows you a heatmap of usage across every room, updated continuously
Within a week, you will have a data-driven picture of how your home is actually used. Within a month, the patterns become clear enough to make genuinely informed decisions.
Making Changes Based On The Data
Common actions homeowners take after reviewing their space utilisation data:
- Repurposing underused rooms — converting an empty formal dining room into a home gym or playroom that actually gets used
- Adjusting heating zones — programming the thermostat based on real occupancy patterns rather than guesswork
- Rethinking renovation priorities — investing in spaces where the data shows the highest usage
- Improving home office setup — understanding peak focus times to design a more productive work environment
Frequently asked questions
What is space utilisation in a home?
Space utilisation refers to how much time each room or area of a home is actually occupied and in use. Home intelligence platforms measure this automatically using occupancy detection technology.
Why does home space utilisation matter?
Understanding how your home is used helps you make better decisions about energy use, renovations, room repurposing and property planning — all based on evidence rather than assumption.
How is room usage measured without cameras?
SPECTRA uses WiFi signal analysis to detect the presence of people in each room. Combined with a LiDAR floorplan, the system can attribute occupancy to specific rooms without capturing any images.
Which rooms are typically used most in a home?
Data from home intelligence platforms consistently shows that kitchens, main living areas and primary bedrooms account for the majority of daily occupancy in most homes. Formal dining rooms and spare bedrooms are often significantly underused.
Can space utilisation data help me save energy?
Yes. Knowing which rooms are actually occupied — and when — allows you to heat, cool and light only the spaces being used, reducing energy waste significantly.